

The Case for Private Credit After a Reset in the Public Markets
April 6, 2023 | 10 min read
Over the course of the last year, global capital markets were forced to contend with geopolitical uncertainty, persistently high inflation, and weakening economies around the world. Central banks responded to inflationary pressures by raising short term interest rates, leading to higher all-in yields in the public fixed income markets – a dynamic which has some allocators asking if they should re-direct future private credit allocations to the public fixed income markets.
While the trajectory of the public markets may seem less clear for investors, particularly after recent volatility in the banking sector, we believe that the private credit market continues to offer allocators compelling advantages relative to the public markets – including an illiquidity (or yield) premium, meaningful downside protection, and greater resiliency during periods of heightened volatility; themes that we explore in greater detail below.
Private credit market offers an illiquidity premium
The direct lending market1 has outperformed the broadly syndicated loan market2 in 16 out of the last 17 years,3 which highlights both the consistency and reliability of the asset class. Over that time, the direct lending market has, on average, outperformed the syndicated loan market by 400 bps on a total return basis and exhibited a much shallower drawdown during periods of market stress, like the Global Financial Crisis (GFC).4 Today, the illiquidity premium for the direct lending market has compressed relative to other historical periods, but it remains positive.
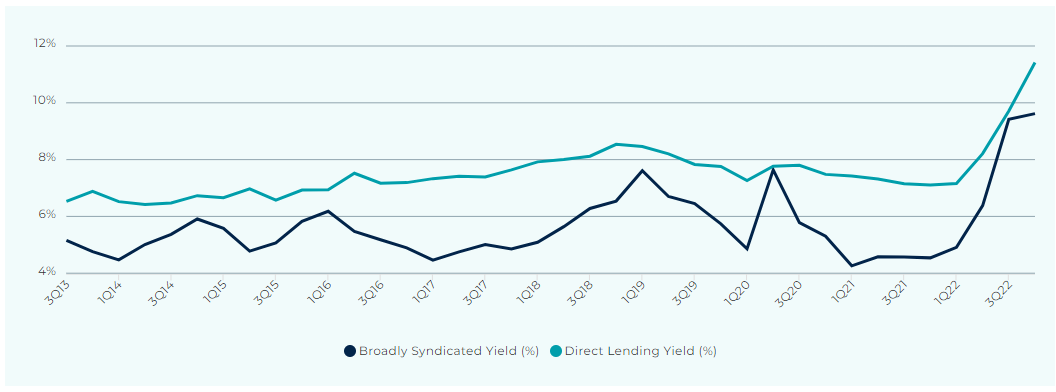
In the chart below, we plot the historical yield of the broadly syndicated loan market relative to the direct lending market for first lien securities and find that, as of year-end 2022, the direct lending market continues to outyield the syndicated loan market by 1.8%. Additionally, the current all-in yield for first dollar risk is between 11-12%, which nears an all-time high for the senior direct lending market, while still maintaining an average loan to value of approximately 40%.5
Historical yields: broadly syndicated loans vs. direct lending
Source: Refinitiv data as of 12/31/2022.
Private credit tends to be more resilient than public fixed income
The direct lending market is generally focused on more resilient industries that are less susceptible to volatility due to economic cycles, such as business services, healthcare, and information technology. These sectors tend to exhibit greater cash flow stability and predictability with less sensitivity to changes in the broader US economy. As the private credit market has grown from $311.5 billion in 2010 to nearly $1.4 trillion in 2022,6 there is an even greater opportunity for private credit managers to build highly diversified portfolios by industry, issuer, and security type (first lien, unitranche, etc).
In addition to focusing on less cyclical segments of the market, direct lenders benefit from the bespoke nature of private credit transactions, where information is shared between the private equity sponsor and the lender to ensure transparency and alignment of interests. Both parties have the flexibility to amend terms of the agreement throughout the life of the loan to ensure that the structure of the transaction supports the borrower’s ability to service its debt obligations. This flexibility is not available in the public markets where a high yield bond, for example, could be spread across hundreds of investors at any point in time — making it more difficult to establish ongoing alignment of investor interests and agreement on potential amendments throughout the life of the loan. More specifically, in a downside work-out scenario, a private credit deal can potentially better preserve enterprise value as a small group of like-minded lenders is more inclined to agree on a restructuring plan than a disparate group of bondholders that may choose to sell to distressed players and delay an orderly restructuring.
Practically speaking, the structural features of the private markets result in lower default rates and higher recovery rates. The historical default rate of the private credit markets has been close to 2% with recovery rates near 60-70% for senior loans.7 This compares to the high yield market which has experienced default rates closer to 3.6% and recovery rates closer to 45%.8
In addition to the lower risk and higher recovery rates, private markets continue to gain share of private equity financings. The direct lending market represented 72% of financings in 2022 relative to 28% of the syndicated market, which expands the addressable market for private credit managers and allows them to build increasingly diversified portfolios across industries and borrowers.9
Public fixed income markets can be unstable
The public fixed income market is an over-the-counter market, meaning that bonds and syndicated loans do not trade on an exchange like equities. Instead, dealers facilitate the trading of fixed income securities by lining up buyers and sellers of individual securities, and they are compensated by capturing a bid-offer spread. Dealers use balance sheet capital to support orderly markets, often warehousing fixed income securities when there is a seller of a particular security but not a buyer at a given point in time. The willingness of a dealer to use balance sheet capital for this purpose historically provided liquidity and price stability in the fixed income markets.
However, there have been two important developments in the public fixed income market since the GFC which have had important implications both for the fixed income market broadly and the role it plays in investors’ portfolios. First, the size of the US bond market has increased meaningfully, with the market value of the US fixed income market increasing from just under $30 trillion pre-GFC, to over $53 trillion today.10 Second, the amount of capital devoted to market making activities by dealers has remained between $30-40 billion, post GFC, despite significant growth in the fixed income markets.11
This relationship has made the public fixed income markets inherently less liquid as there is proportionally less capital relative to the size of the market from the dealer community to provide liquidity. In turn, it has led to increased price volatility across public fixed income markets. Liquidity has also become more sporadic. For example, when the volatility in risk markets rises, liquidity tends to dissipate in fixed income markets as dealers are less willing to provide balance sheet capital to make markets for securities when the flow is one directional.
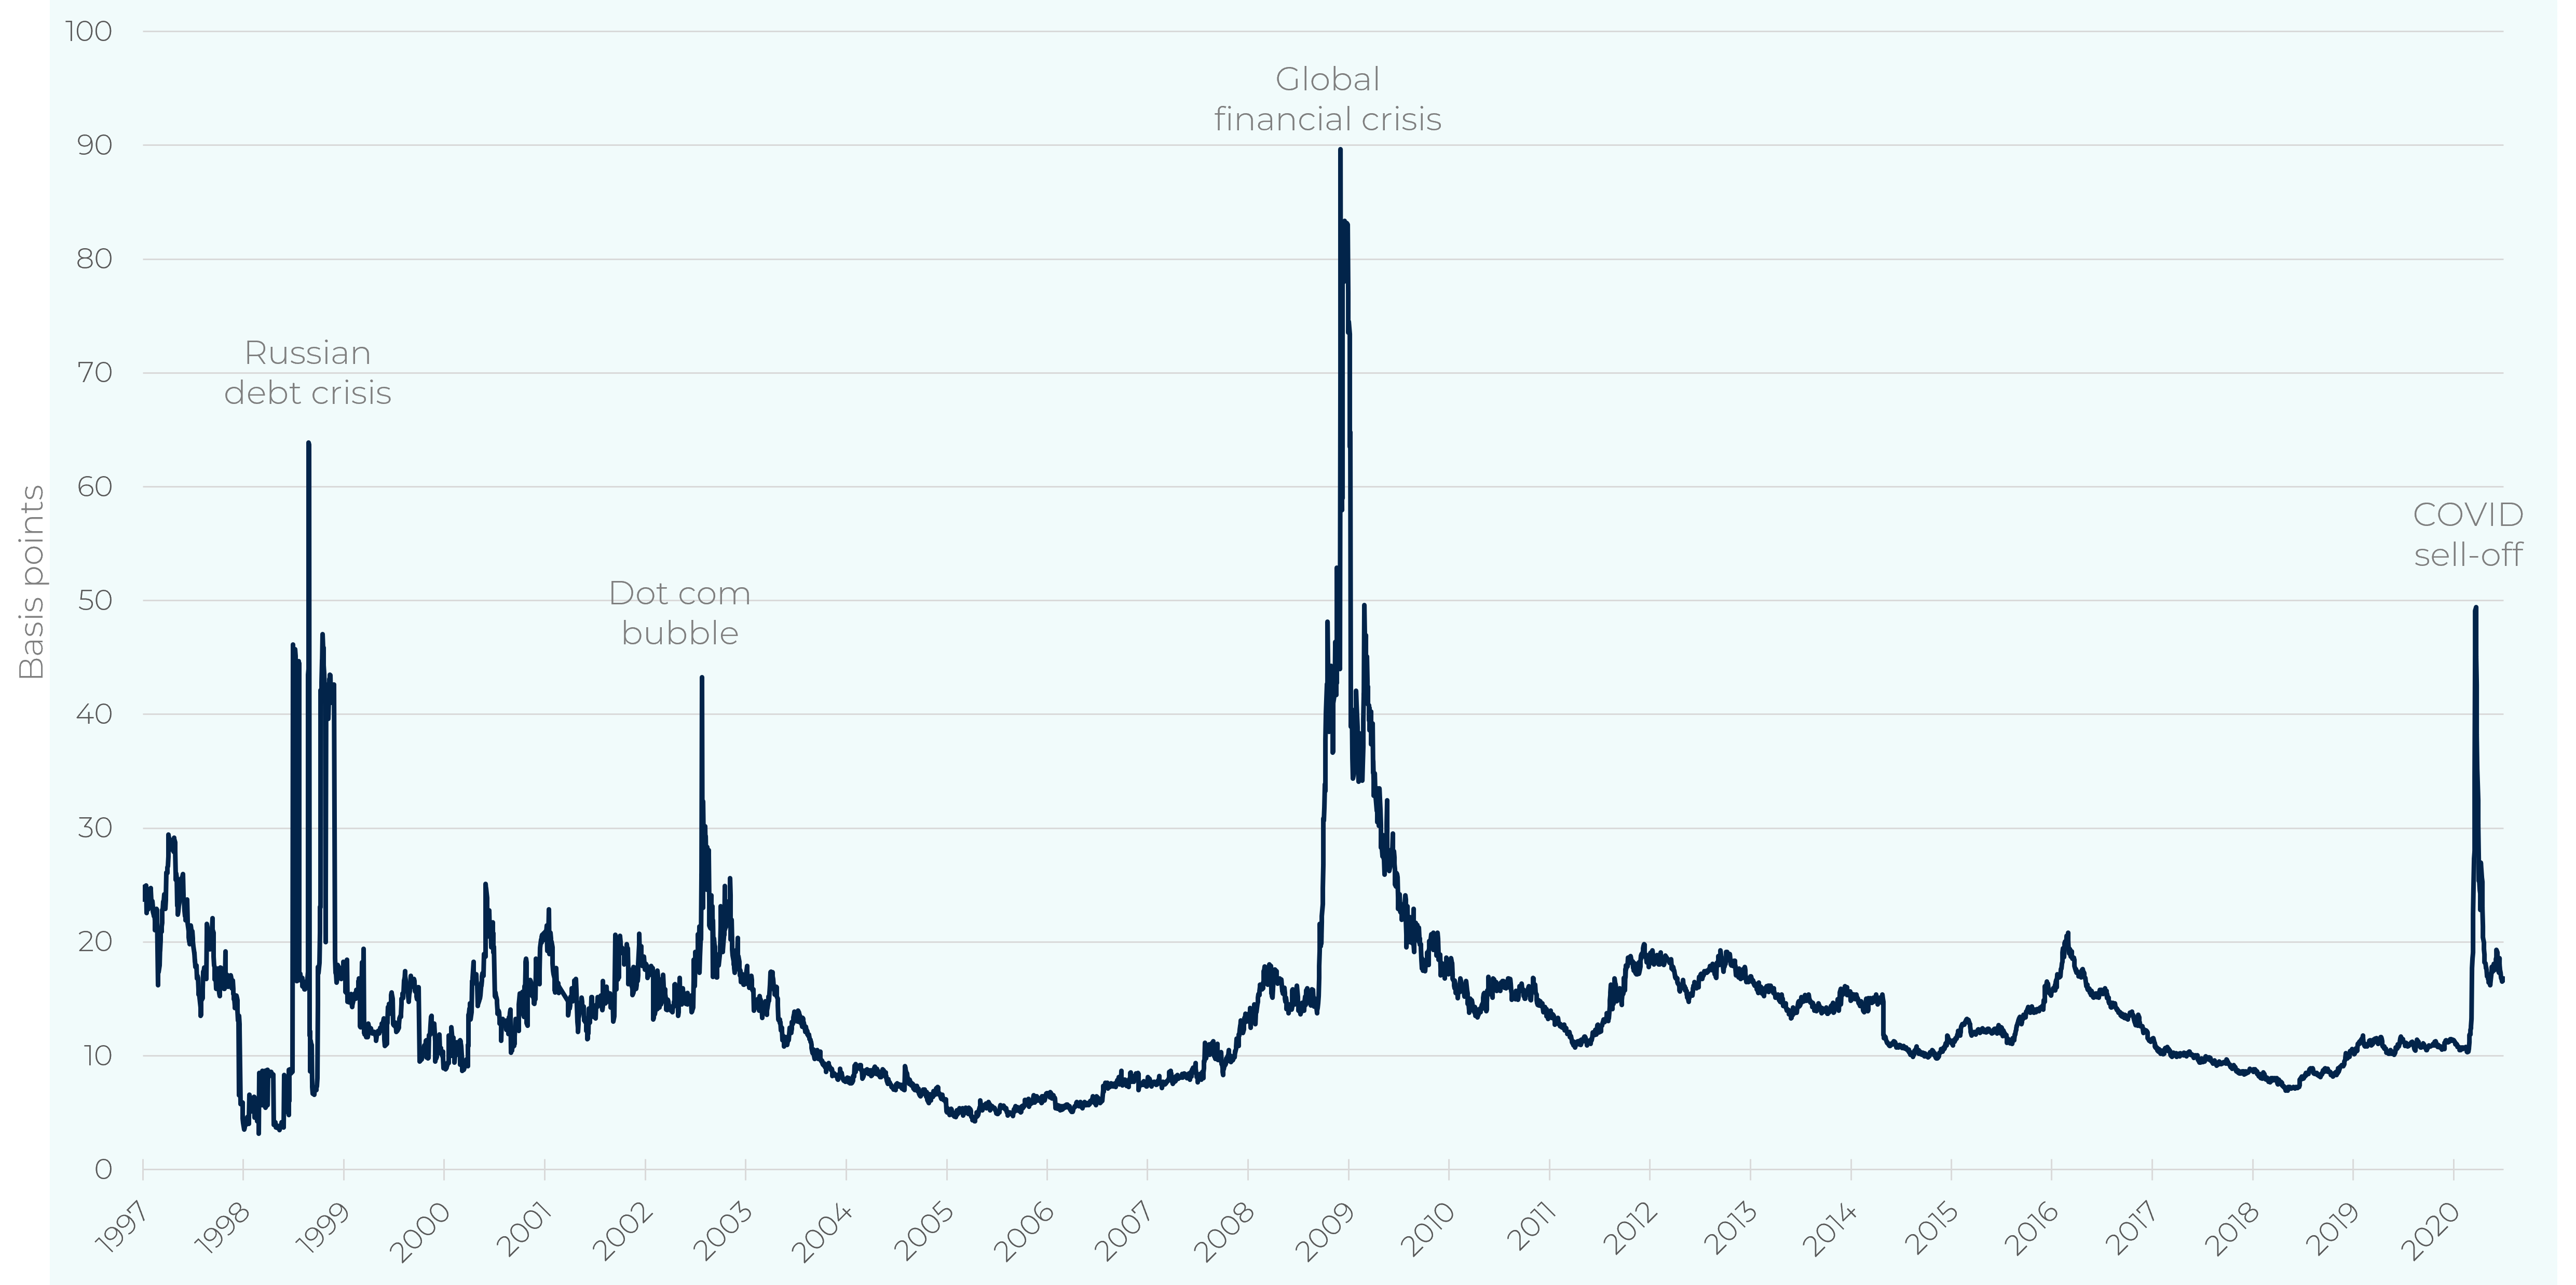
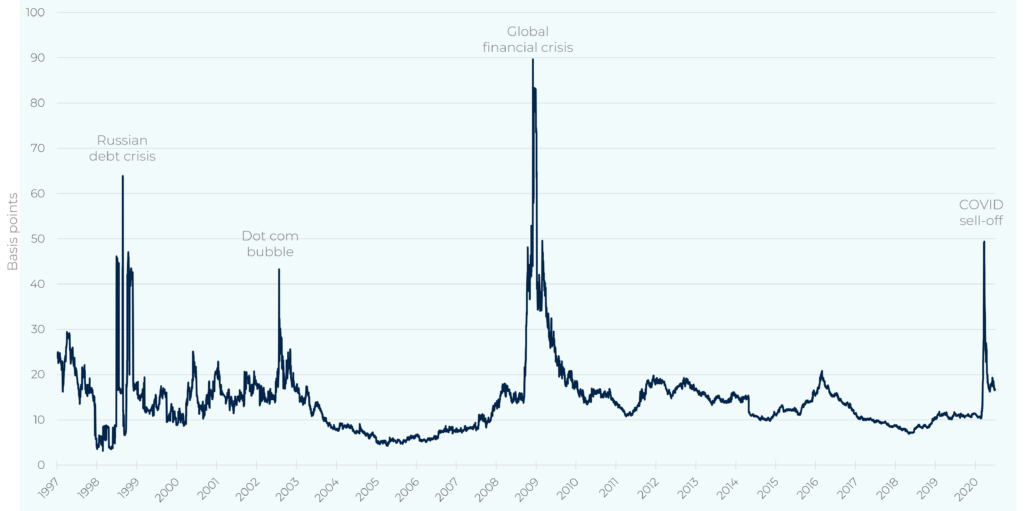
In the chart below, we plot the cost of liquidity of the corporate bond market, which is a function of the bid/offer spread and the duration of the underlying securities. This shows that during periods of heightened stock market volatility, bid/offer spreads typically widen and the cost for liquidity increases meaningfully in the public markets, often when liquidity is needed most by investors.
Cost of liquidity for corporate bonds
Source: Federal Reserve, “Dealer Inventory Constraints in the Corporate Bond Market during the COVID Crisis” 7/15/21.
Chart shows the average divergence between an individual bond’s yield and the yield curve of its issuer, which is representative of the cost for liquidity for a particular issue.
Key takeaways
Historically, investors allocate to public fixed income markets to generate income, diversify risk assets, and to preserve liquidity. Since the GFC, instability within the fixed income markets has caused many segments of fixed income to trade directionally in line with other risk assets, like equities, particularly during periods of volatility when diversification is needed most. Finally, as witnessed during the early days of the COVID pandemic, or the most recent bank crisis, liquidity in the fixed income market has tended to dry up at inopportune times, diluting one of the key benefits that public fixed income markets are meant to provide allocators in volatile markets.
We see three key reasons why investors can continue benefitting from an allocation to private fixed income versus public:
Investors in private credit are compensated for locking up their capital with an illiquidity premium. Even after the most recent reset in the public fixed income markets, there is still an illiquidity premium to be earned in the private credit markets.
The private credit market is focused on less cyclical sectors and tends to be more resilient than the public fixed income markets, which is evidenced by lower default rates and higher recovery rates.
Private credit offers a point of stability and diversification relative to other risk assets and has been less impacted by technical buying/selling pressures and the broader instability of the public fixed income markets post-GFC.
The current environment offers a particularly attractive opportunity in the private credit markets. Due to base rates rising to near 5%, the widening of credit spreads, and the closure of the syndicated loan market, the private credit market is currently pricing north of 11-12% for first dollar risk, and opportunities in the junior credit market are pricing north of 15%.12 Despite higher all-in yields, many opportunities are coming to the market with lower leverage levels than just a year prior, which is why we believe this could be a particularly attractive vintage for private credit funds. Additionally, the floating rate nature of the asset class provides a valuable hedge to rising interest rates, compared to the public markets which tend to focus on fixed rate securities that can be adversely impacted from rising rates. Pulling this all together, we believe that private credit managers, with access to best-in-class GPs, have the ability to focus on the highest quality deals and deliver risk adjusted return that is difficult to find in the current market environment.
Would you like to discuss current opportunities in private credit?
- As proxied by the Cliffwater Direct Lending Index (CDLI).
- As proxied by the Morningstar LSTA Levered Loan Index.
- Source: Cliffwater, data as of 12/31/2022.
- Source: HarbourVest, based on Cliffwater and Morningstar data through 12/31/2022.
- Source: HarbourVest, as of March 2023.
- Source: Preqin, Global Reports 2023: Private Debt, 12/14/2022.
- Source: Cliffwater, data as of 6/30/2022.
- Source: Fitch, data as of 12/31/2022.
- Source: Refinitiv, data as of 12/31/2022.
- Source: SIMFA, as of 12/31/22.
- Source: Federal Reserve, as of July 2021 and NY Fed CMDI as of 12/31/2022.
- Source: HarbourVest Partners, data as of 12/31/22.
This material is solely for informational purposes and should not be viewed as a current or past recommendation or an offer to sell or the solicitation to buy securities or adopt any investment strategy. The opinions expressed herein represent the current, good faith views of the author(s) at the time of publication, are not definitive investment advice, and should not be relied upon as such. This material has been developed internally and/or obtained from sources believed to be reliable; however, HarbourVest does not guarantee the accuracy, adequacy or completeness of such information. There is no assurance that any events or projections will occur, and outcomes may be significantly different than the opinions shown here. This information, including any projections concerning financial market performance, is based on current market conditions, which will fluctuate and may be superseded by subsequent market events or for other reasons.